QuickSort

Selected work

Products we've shipped to production

We work with founders, research consortia, and established businesses to design, build, and launch software that goes into real use. A few highlights below.

AV Integration screenshot

Smart automation · Luxury hospitality

AV Integration

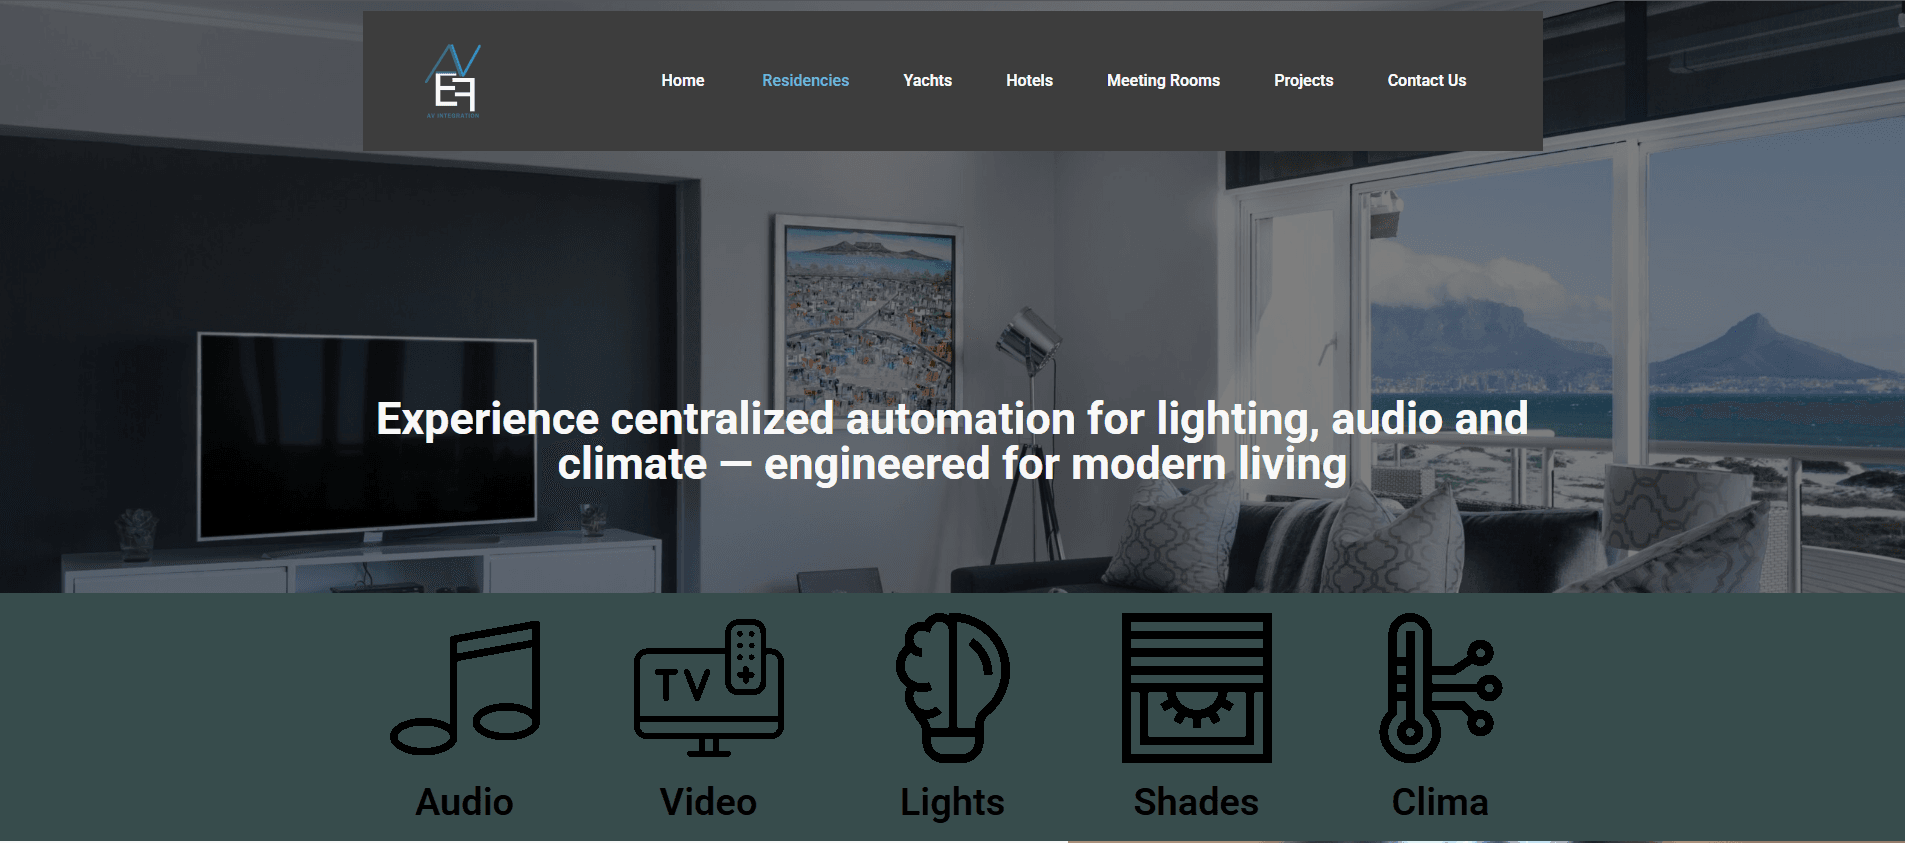
AV Integration is a Greek smart-automation company specialising in audio, video, lighting, and climate control systems for luxury residences, yachts, and hospitality venues. They needed a corporate website that communicated craftsmanship and bespoke service to a high-end audience, without feeling like a generic consumer-electronics site.

What we delivered

  • Brand-led corporate website with full English content
  • Responsive layout optimised for desktop, tablet, and mobile
  • Modular content sections so the team can extend services and case studies over time
  • SEO-ready structure with semantic markup and Open Graph metadata

Tech stack

Next.jsTypeScriptTailwind CSSVercel
Visit live site
EXANTAS screenshot

EU-funded fintech research

EXANTAS

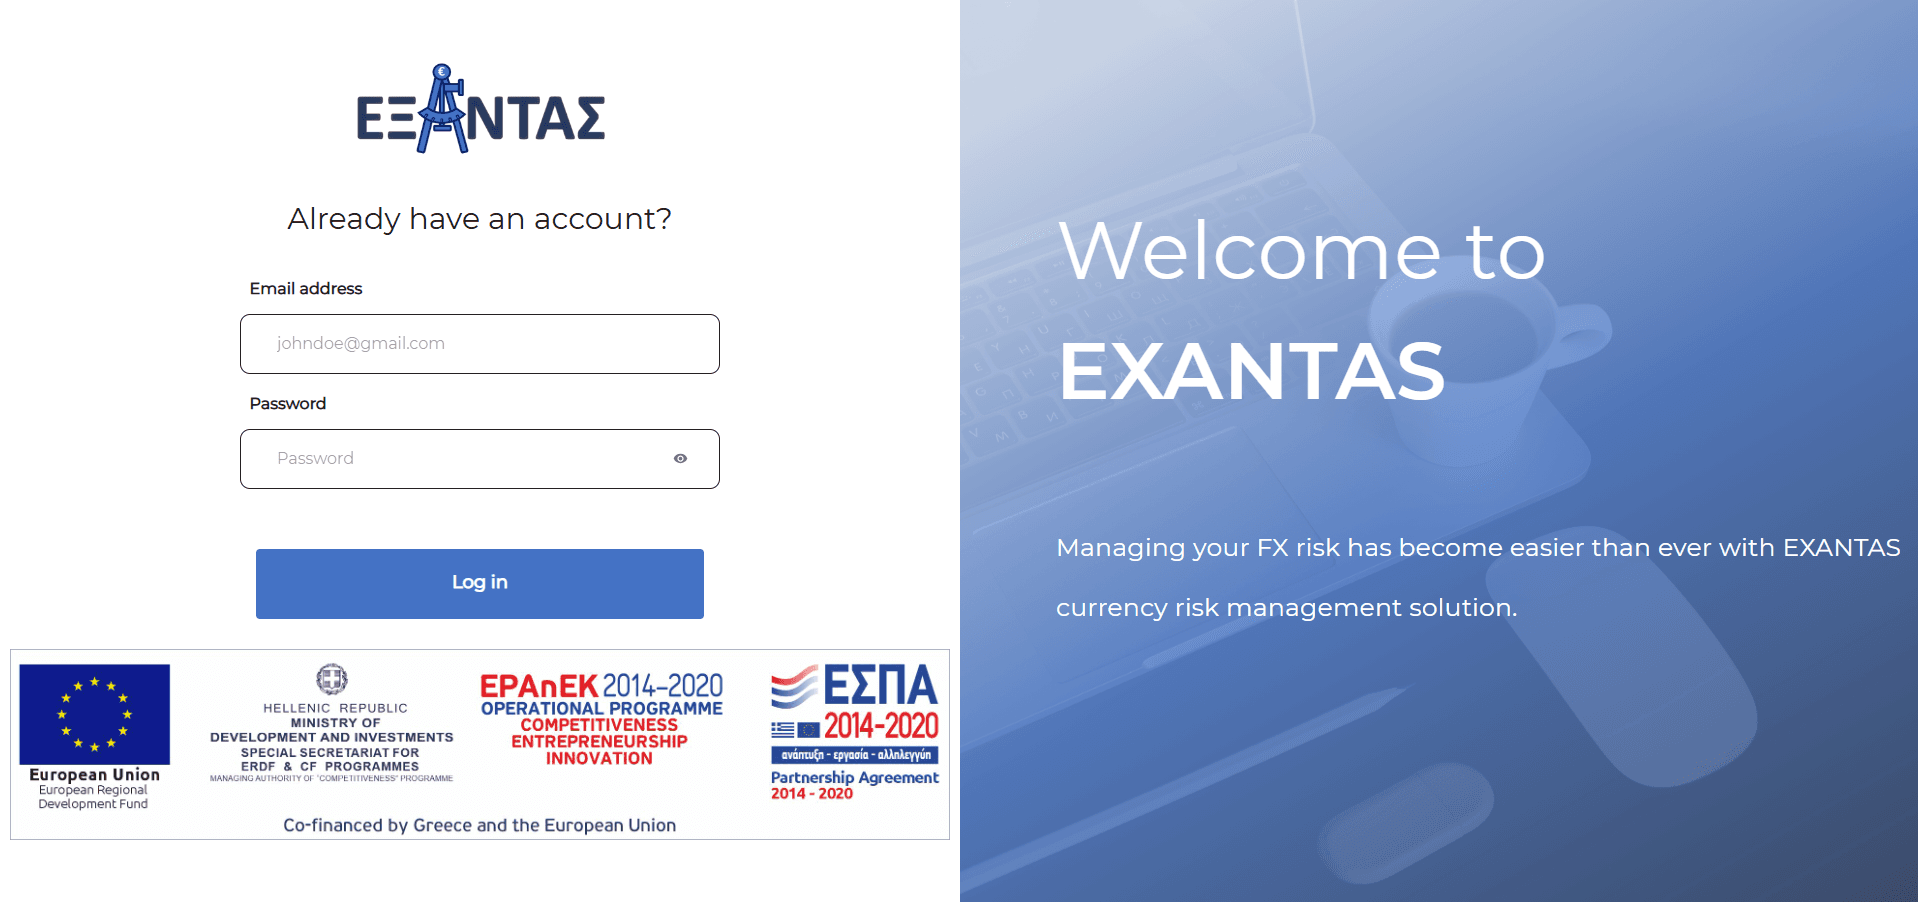
EXANTAS is an EU-funded fintech research project developing the first holistic technological solution for optimising foreign-exchange decisions for small-scale transactions in Greece and beyond. The platform brings automated investment tools and personalised recommendations — historically reserved for institutional clients — to retail investors and small businesses.

What we delivered

  • Production web application for retail FX analytics and recommendations
  • Interactive dashboards surfacing ML-driven trading signals to non-expert users
  • Dedicated ASP.NET backend built on Clean Architecture, deployed on a dedicated server
  • Authentication, user management, and role-based access control
  • Integration layer between the backend recommendation services and market-data feeds

Tech stack

Next.jsTypeScriptReactASP.NETC#Clean ArchitectureDedicated server
Visit live site
Agricultural Pest Monitoring Map screenshot

Data visualization · Custom BI

Agricultural Pest Monitoring Map

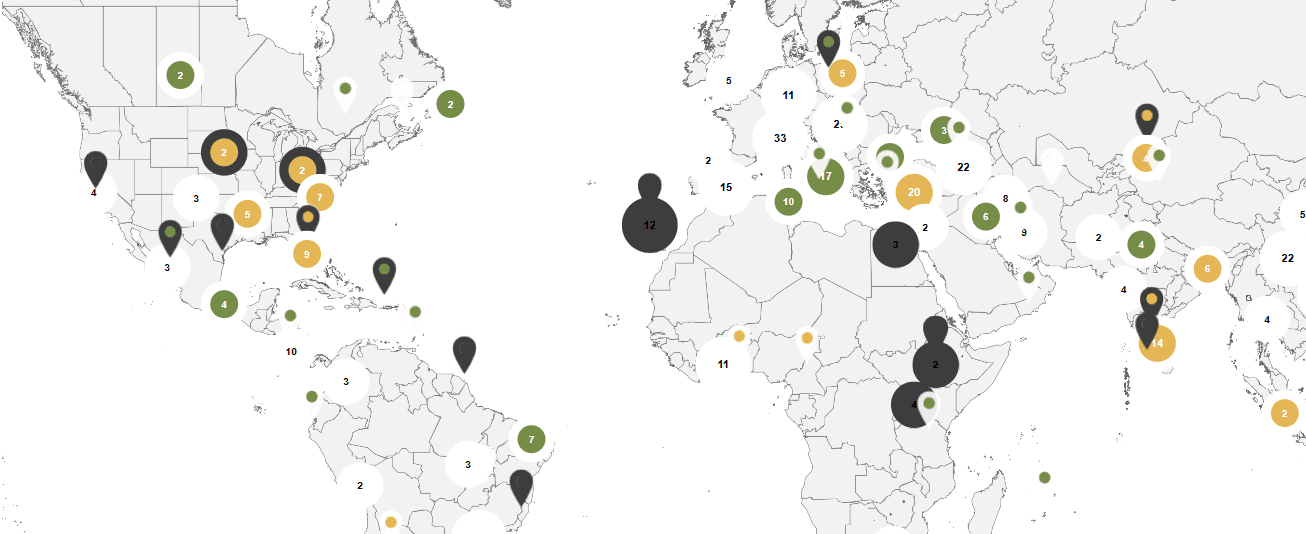
An organization monitoring agricultural pests across regions needed to see observations by country on a single interactive map. Their data lived in separate standardized datasets — host, master, and observation records — for each pest, with no unified view, and the built-in map couldn't represent what they needed.

What we delivered

  • A custom Leaflet map visual for Power BI with choropleth country shading and clustered markers
  • A per-country info panel showing observation counts at a glance
  • A consolidated data model unifying multiple per-pest datasets into one source of truth, keyed on a shared reference ID
  • Lookup tables and reshaping (append / unpivot) so every pest, host, and observation lines up across the model
  • A documented, repeatable process for adding or removing a pest without breaking the model

Tech stack

Power BI Custom VisualLeafletTypeScriptPower QueryData modelling
Advanced Table Visual for Power BI screenshot

Reporting tools · Custom BI

Advanced Table Visual for Power BI

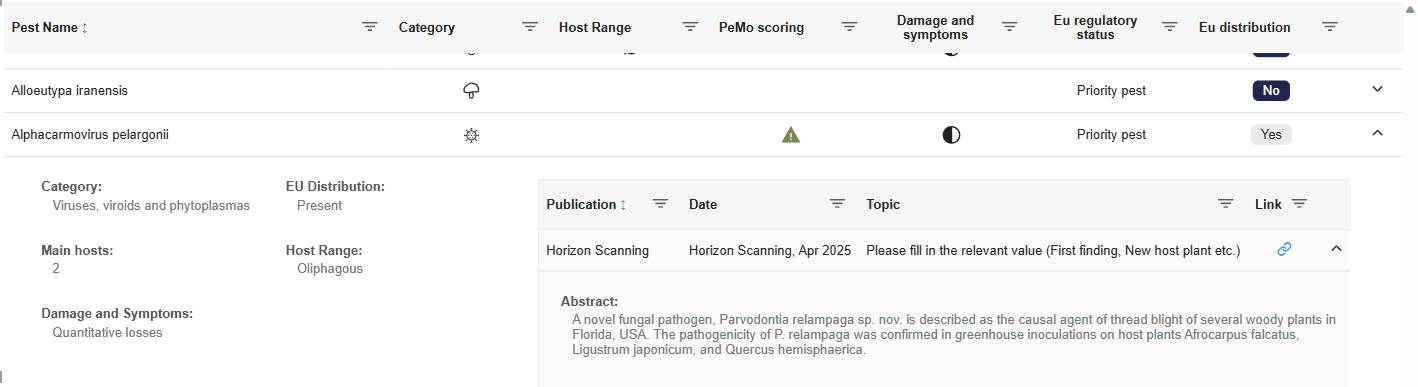
A reporting-heavy project had outgrown the standard Power BI table: users needed to filter, group, and page through large datasets inside the report, and kept exporting to Excel to do it. The goal was a table that behaves like a real data-exploration tool without leaving the report.

What we delivered

  • A custom table visual built with React and TanStack Table
  • Type-aware per-column filtering — numeric operators and case-insensitive text search
  • Row grouping with expand / collapse and nested detail rows
  • Drag-to-resize columns, pagination, and tooltips for truncated text
  • Smooth performance on datasets up to 30,000 rows

Tech stack

Power BI Custom VisualReactTanStack TableTypeScript

Have a product in mind?

If you're shaping a new platform, modernising an existing one, or scoping a research deliverable, we'd be glad to talk.